Formazione & insegnamento, 24(02), 8669
Teachers’ Digital Competence in the Hybrid School: The Path Towards Digital Capability
Le competenze digitali degli insegnanti nella scuola ibrida: Il percorso verso una capacitazione digitale
ABSTRACT
This contribution presents and analyses the Digimetrò training project, aimed at fostering teachers’ digital empowerment within the framework of a larger project called “Hybrid school”. The programme involved 1,286 teachers from different school levels across 61 courses organised into nine thematic categories. Its impact was monitored through a pre–post research design (t0–t1), based on self-assessment of competences according to the European DigCompEdu framework and on professional satisfaction indicators derived from the TALIS job satisfaction scale. Findings show a widespread, though moderate, improvement in perceived digital competences across all DigCompEdu areas, with particularly significant gains in emerging technologies, inclusion and accessibility, personalisation, and the promotion of students’ digital skills. At the same time, while teachers report generally positive internal job satisfaction, they express strong dissatisfaction regarding the social, economic, and political recognition of their profession. The project highlights a systemic paradox: although teachers demonstrate professional growth and openness to digital innovation, institutional and societal recognition remains inadequate. Digital empowerment cannot be reduced to a set of isolated technical skills; rather, it requires a coherent ecosystem of educational policies, adequate working conditions, and professional recognition.
Questo contributo presenta e analizza il progetto di formazione Digimetrò, volto a promuovere l’empowerment digitale degli insegnanti nell’ambito di un progetto più ampio denominato “Scuola ibrida”. Il programma ha coinvolto 1.286 insegnanti di diversi livelli scolastici in 61 corsi organizzati in nove categorie tematiche. Il suo impatto è stato monitorato attraverso un disegno di ricerca pre-post (t0–t1), basato sull’autovalutazione delle competenze secondo il quadro europeo DigCompEdu e su indicatori di soddisfazione professionale derivati dalla scala di soddisfazione lavorativa TALIS. I risultati mostrano un miglioramento diffuso, anche se moderato, delle competenze digitali percepite in tutte le aree DigCompEdu, con progressi particolarmente significativi nelle tecnologie emergenti, nell’inclusione e nell’accessibilità, nella personalizzazione e nella promozione delle competenze digitali degli studenti. Allo stesso tempo, mentre gli insegnanti riferiscono una soddisfazione lavorativa interna generalmente positiva, esprimono una forte insoddisfazione per quanto riguarda il riconoscimento sociale, economico e politico della loro professione. Il progetto evidenzia un paradosso sistemico: sebbene gli insegnanti dimostrino una crescita professionale e un’apertura all’innovazione digitale, il riconoscimento istituzionale e sociale rimane inadeguato. L’empowerment digitale non può essere ridotto a un insieme di competenze tecniche isolate, ma richiede piuttosto un ecosistema coerente di politiche educative, condizioni di lavoro adeguate e riconoscimento professionale.
KEYWORDS
Digital competence, Teachers, Professional development, Training
Competenze digitali, Insegnanti, Formazione professionale, Training
AUTHORSHIP
This article is the result of the work of a single Author.
ACKNOWLEDGMENTS
The Author acknowledges the support of Professor Piergiuseppe Ellerani and Daniele Barca, Principal of IC3 “Mattarella” (Modena), who managed the project investigated in this study.
CONFLICTS OF INTEREST
The Author declares no conflicts of interest.
COPYRIGHT AND LICENSE
© Author(s). This article and its supplementary materials are released under a CC BY 4.0 license.
RECEIVED
February 20, 2026
ACCEPTED
May 8, 2026
PUBLISHED ONLINE
July 13, 2026
1. Introduction
In the context of a constantly changing hybrid school system, the concept of teachers’ digital competence takes on a strategic role that can no longer be postponed. Today’s schools are immersed in a society that is now completely saturated with digital technology in all its aspects: a society that can no longer be understood in terms of online or offline (Floridi, 2017), in which the post-media condition (Eugeni, 2015) and the increasingly widespread use of Artificial Intelligence (AI) systems have not only forced a reconfiguration of the digital landscape tout-court but have also exposed the educational institution itself to ever-increasing complexity.
It is no longer a question of simply knowing how to use tools and applications, but rather of moving towards digital capability[1] understood as a form of critical, reflective and situated mastery of technologies, capable of integrating into teaching and learning processes in an authentic and transformative way.
Several theoretical frameworks have been developed to map and support teachers’ digital competence. The Technological Pedagogical Content Knowledge (TPACK) model (Mishra & Koehler, 2006) describes the interplay between technological, pedagogical and content knowledge as the foundation of effective technology-enhanced teaching. Rather than treating technology as an add-on to existing practice, TPACK posits that effective digital integration requires teachers to develop a specific form of knowledge that emerges from the intersection of all three domains, one that cannot be reduced to mastery of tools alone but involves understanding how technology shapes and is shaped by disciplinary content and pedagogical choices. At the international policy level, UNESCO’s ICT Competency Framework for Teachers (UNESCO, 2018) provides a structured progression across three levels (knowledge acquisition, knowledge deepening, and knowledge creation) explicitly linking teachers’ digital competence to broader goals of educational transformation and sustainable development. What is remarkable in this framework is its systemic perspective: it does not address digital competence as an isolated professional skill but embeds it within a vision of teaching as a driver of societal change. Similarly, the ISTE Standards for Educators (Crompton, 2023; ISTE, 2024) offer a further complementary lens, articulating digital competence through a set of practitioner roles—including learner, leader, citizen, collaborator, designer, facilitator and analyst—that reflect the multidimensional nature of teachers’ professional engagement with technology. While these frameworks differ in scope and emphasis, they converge on the idea that digital competence is not a fixed technical attribute but a dynamic, context-sensitive capacity: a premise that aligns with the notion of digital capability adopted in this study and operationalised through the DigCompEdu framework.
Educating about and with technologies today means accompanying students towards a conscious use of digital technology, through the construction of meanings, paths and environments that can represent a real benefit and a concrete resource for both learners and teachers.
The “Hybrid school project” (Ellerani et al., 2023) is not just an emergency or logistical organisational solution, but a real theoretical and methodological direction that requires a redefinition of educational practices. In this context, teachers’ digital competences are not incidental but take on a structural role of primary importance: they form the foundation for imagining and building co-disciplinary, intercultural, collaborative educational paths and environments capable of enhancing the potential of technology and the students themselves. All this is supported by a design approach that views digital technology as the connective tissue for invention, participation and the shared construction of knowledge.
Despite the growing body of research on teachers’ digital competence, large-scale training programmes that combine a structured competence framework, a pre-post monitoring design, and an analysis of professional satisfaction remain relatively underexplored in the Italian context. This study aims to contribute to filling this gap by presenting and analysing the Digimetrò project as a case of institutionally supported digital empowerment.
Therefore, the importance and inevitable necessity of training teachers in these areas emerges strongly: a concrete need to which the Digimetrò project has sought to provide an answer.
2. The Digimetrò training programme
The Digimetrò training initiative was developed within the framework of the Italian National Recovery and Resilience Plan (PNRR), specifically under Mission 4, Component 1 “Integrated digital teaching and training for the digital transition of school staff”, financed by the European Union—NextGenerationEU. The project was awarded a total budget of €400,000 and ran from December 2022 to September 2024 (CUP: C94D22001450006; Project code: M4C1I2.1-2022-921-P-1808). The lead institution was the IC3 “Mattarella” of Modena, directed by Daniele Barca, which coordinated a network of 18 scientific and training partners, including the Department of Education Studies of the University of Bologna, in the role of scientific partner. The initiative was articulated through the creation and monitoring of 61 courses aimed at teachers at all school levels, held during the 2023/2024 school year. Of these, 60 were delivered online, while one course—the summer school—took place in person in July 2023 in Modena, in IC3 “Mattarella”, the school that was responsible for managing the whole project.
Each course, lasting a total of 24 hours, was supported by an LCMS platform for collaborative work, created using Google Classroom. This tool allowed teachers to organise training activities in synchronous mode, accompanied by individual or group exercises.
There were nine thematic categories of structured training proposals:
- Summer school: during the summer school, the only face-to-face training opportunity, participants addressed various STEAM-related topics such as coding, artificial intelligence, and the design of inclusive learning environments, as well as how to use these technologies to work in the arts and humanities.
- Environments: courses in this category addressed the design of innovative hybrid school environments, both physical and virtual, and the co-production of digital resources with colleagues and students;
- Subjects and curriculum: courses in this category reflected on how technologies could contribute to the teaching of specific subjects or to the more cross-curricular design of the school curriculum;
- Frida: the course in this category focused on creative and artistic intelligence, basing the training proposal on the creation of musical and visual artefacts through digital technologies;
- Lucy: the courses offered in this category focused on artificial intelligence, coding, educational robotics and the development of computational thinking;
- Marghe: the courses offered within the Marghe category were structured to address, from different points of view, the humanities (vehicular languages, history, geography, etc.) in the age of digital humanities;
- Mary: the courses in this category addressed the theme of creativity and conscious learning, approaching aspects such as social and emotional intelligence, learning to learn, motivation, and cognitive enhancement;
- Maia: The training proposals in this category focused on the theme of natural sciences and how they can be addressed with technology in the classroom.
- Minerva: courses in the Minerva category focused on literature, poetry and fiction, exploring how technology can contribute to the design of innovative and inclusive educational programmes.
Participation in the Digimetrò courses was voluntary and open to all teachers affiliated with the partner institutions; no specific selection criteria were applied beyond institutional membership, which reflects the inclusive design of the programme.
3. The research
The Digimetrò training programme was accompanied by a specific research initiative, designed to support and complement the training experience with careful monitoring. The main objective of this research activity was to analyse the evolution of the digital competences of the participating teachers, comparing the levels measured before and after participation in the courses. In addition to digital competence, the research also aimed to assess the degree of professional satisfaction perceived by teachers, exploring any changes in the way they experience and interpret their role in everyday teaching practice.
In this way, the training and research components were integrated into a unified design, aimed not only at the professional development of the participants, but also at producing useful insights for discussing the perceived impact of the project itself.
Course category | Number of courses | Participants in courses | Respondents t0 | Respondents t1 |
Summer School | 1 | 88 | 88 | 24 |
Environments | 11 | 160 | 126 | 52 |
Disciplines and Curricula | 8 | 251 | 172 | 79 |
Frida | 1 | 26 | 21 | 8 |
Lucy | 9 | 180 | 137 | 46 |
Marghe | 20 | 340 | 304 | 82 |
Mary | 3 | 47 | 36 | 7 |
Maia | 4 | 61 | 38 | 10 |
Minerva | 4 | 133 | 103 | 23 |
Total | 61 | 1286 | 1025 | 331 |
Table 1. Summary of Digimetrò course categories, including number of participants and questionnaire respondents.
Table 1 shows the number of courses in each category and the number of participants, for a total of 1286 teachers. Of these, 1025—79.7% of the total—responded to the initial questionnaire (hereinafter referred to as t0), while only 331—equivalent to 32.2% of t0 respondents—responded to the questionnaire administered at the end of each course (hereinafter referred to as t1).
It should be noted that the t0 and t1 questionnaires were administered anonymously, without individual tracking codes. Consequently, it was not possible to match individual responses across the two time points, and the comparison between t0 and t1 was conducted on aggregate data from partially overlapping groups. This design choice reflects the ethical priority of protecting participants’ anonymity and is consistent with the monitoring (rather than experimental) nature of the study. The findings should therefore be interpreted as variations in group-level self-assessment means, rather than as evidence of individual improvement.
The questionnaires structured according to the following sections, containing the items illustrated in Table 2.
Section | Contents |
Personal details section |
|
Digital Competence Section for Education Professionals (DigCompEdu) |
|
Section on personal satisfaction from a work perspective |
|
Table 2. Structure of the questionnaires administered.
The questions in the personal details section were implemented using a closed-ended format, in order to facilitate both completion by respondents and aggregation during analysis.
The section on digital competences was adapted from the online self-assessment tool for the DigCompEdu framework (Redecker et al., 2017) SELFIE for TEACHERS (Economou, 2023; European Commission, n.d.). Each area of competence and each individual competence included responses structured according to a Likert (OECD, 2019) scale with seven possible options, from 0 to 6, each accompanied by a description of that level of proficiency.
For example, competence 1.1. Organisational Communication was accompanied by a brief description (“Use of digital technologies to improve communication with colleagues and/or students and/or parents”) and offered the responses reported in Table 3.
Likert value | Response |
0 | “I have not yet developed this competence” |
1 | “I know that digital technologies can be used for organisational communication (e.g. e-mail, instant messaging, social networks, online learning platforms)” |
2 | “I have tried using digital technologies to communicate with colleagues, students and/or parents (e.g. email, instant messaging, social networks, online learning platforms)” |
3 | “I use different digital technologies according to my organisational communication needs (e.g. communication objective, recipients and context)” |
4 | “I analyse and choose digital technologies based on their functionality and suitability for my organisational communication needs (e.g. personal, effective and efficient communication)” |
5 | “I provide support and advice to colleagues on how to use digital technologies in organisational communication (e.g. for effective, efficient, secure, responsible and inclusive communication at school level)” |
6 | “I contribute to developing organisational practices on communication through digital technologies (e.g. for effective, efficient, secure, responsible and inclusive communication)” |
Table 3. Responses featured in the section “1.1 Organisational Communication”.
With regard to the section on job satisfaction, a number of items were selected from the TALIS tool on the basis of their relevance to perceived social, economic and institutional recognition of the teaching profession: dimensions considered particularly relevant in the context of a publicly funded training initiative. These items were structured according to a numerical Likert scale from 1 to 8.
The reason for choosing to construct a survey tool structured according to these areas of reflection was dictated by the need to understand whether the courses had been useful from the point of view of developing real digital skills and whether participation in them could be perceived as a driver of awareness of one’s level of job satisfaction.
The adapted questionnaire was reviewed by the researcher for face and content validity prior to administration; however, given the exploratory and monitoring-oriented nature of the study, no formal reliability testing (e.g., Cronbach’s alpha) was conducted on the adapted scales, which represents a limitation to be addressed in future research. Regarding the comparability of courses, while all 61 courses shared the same duration (24 hours), delivery format (online, with the exception of the summer school), and platform (Google Classroom), variability in trainers, specific methodologies and thematic focus should be taken into account when interpreting differences across course categories.
3.1. The research population
Of the 1,025 teachers who made up the research population, i.e. those who responded to the t0 questionnaire, the majority were women—892 women compared to 132 men and only 1 who did not wish to respond (Figure 1.a)—and people with 1 to 10 years of service—374 responses for this range, followed by 11–20 years (272), 21–30 (212), 31–40 (121). Teachers with more than 40 years and less than one year of service were equally represented, with 23 respondents in each group (Figure 1.b).
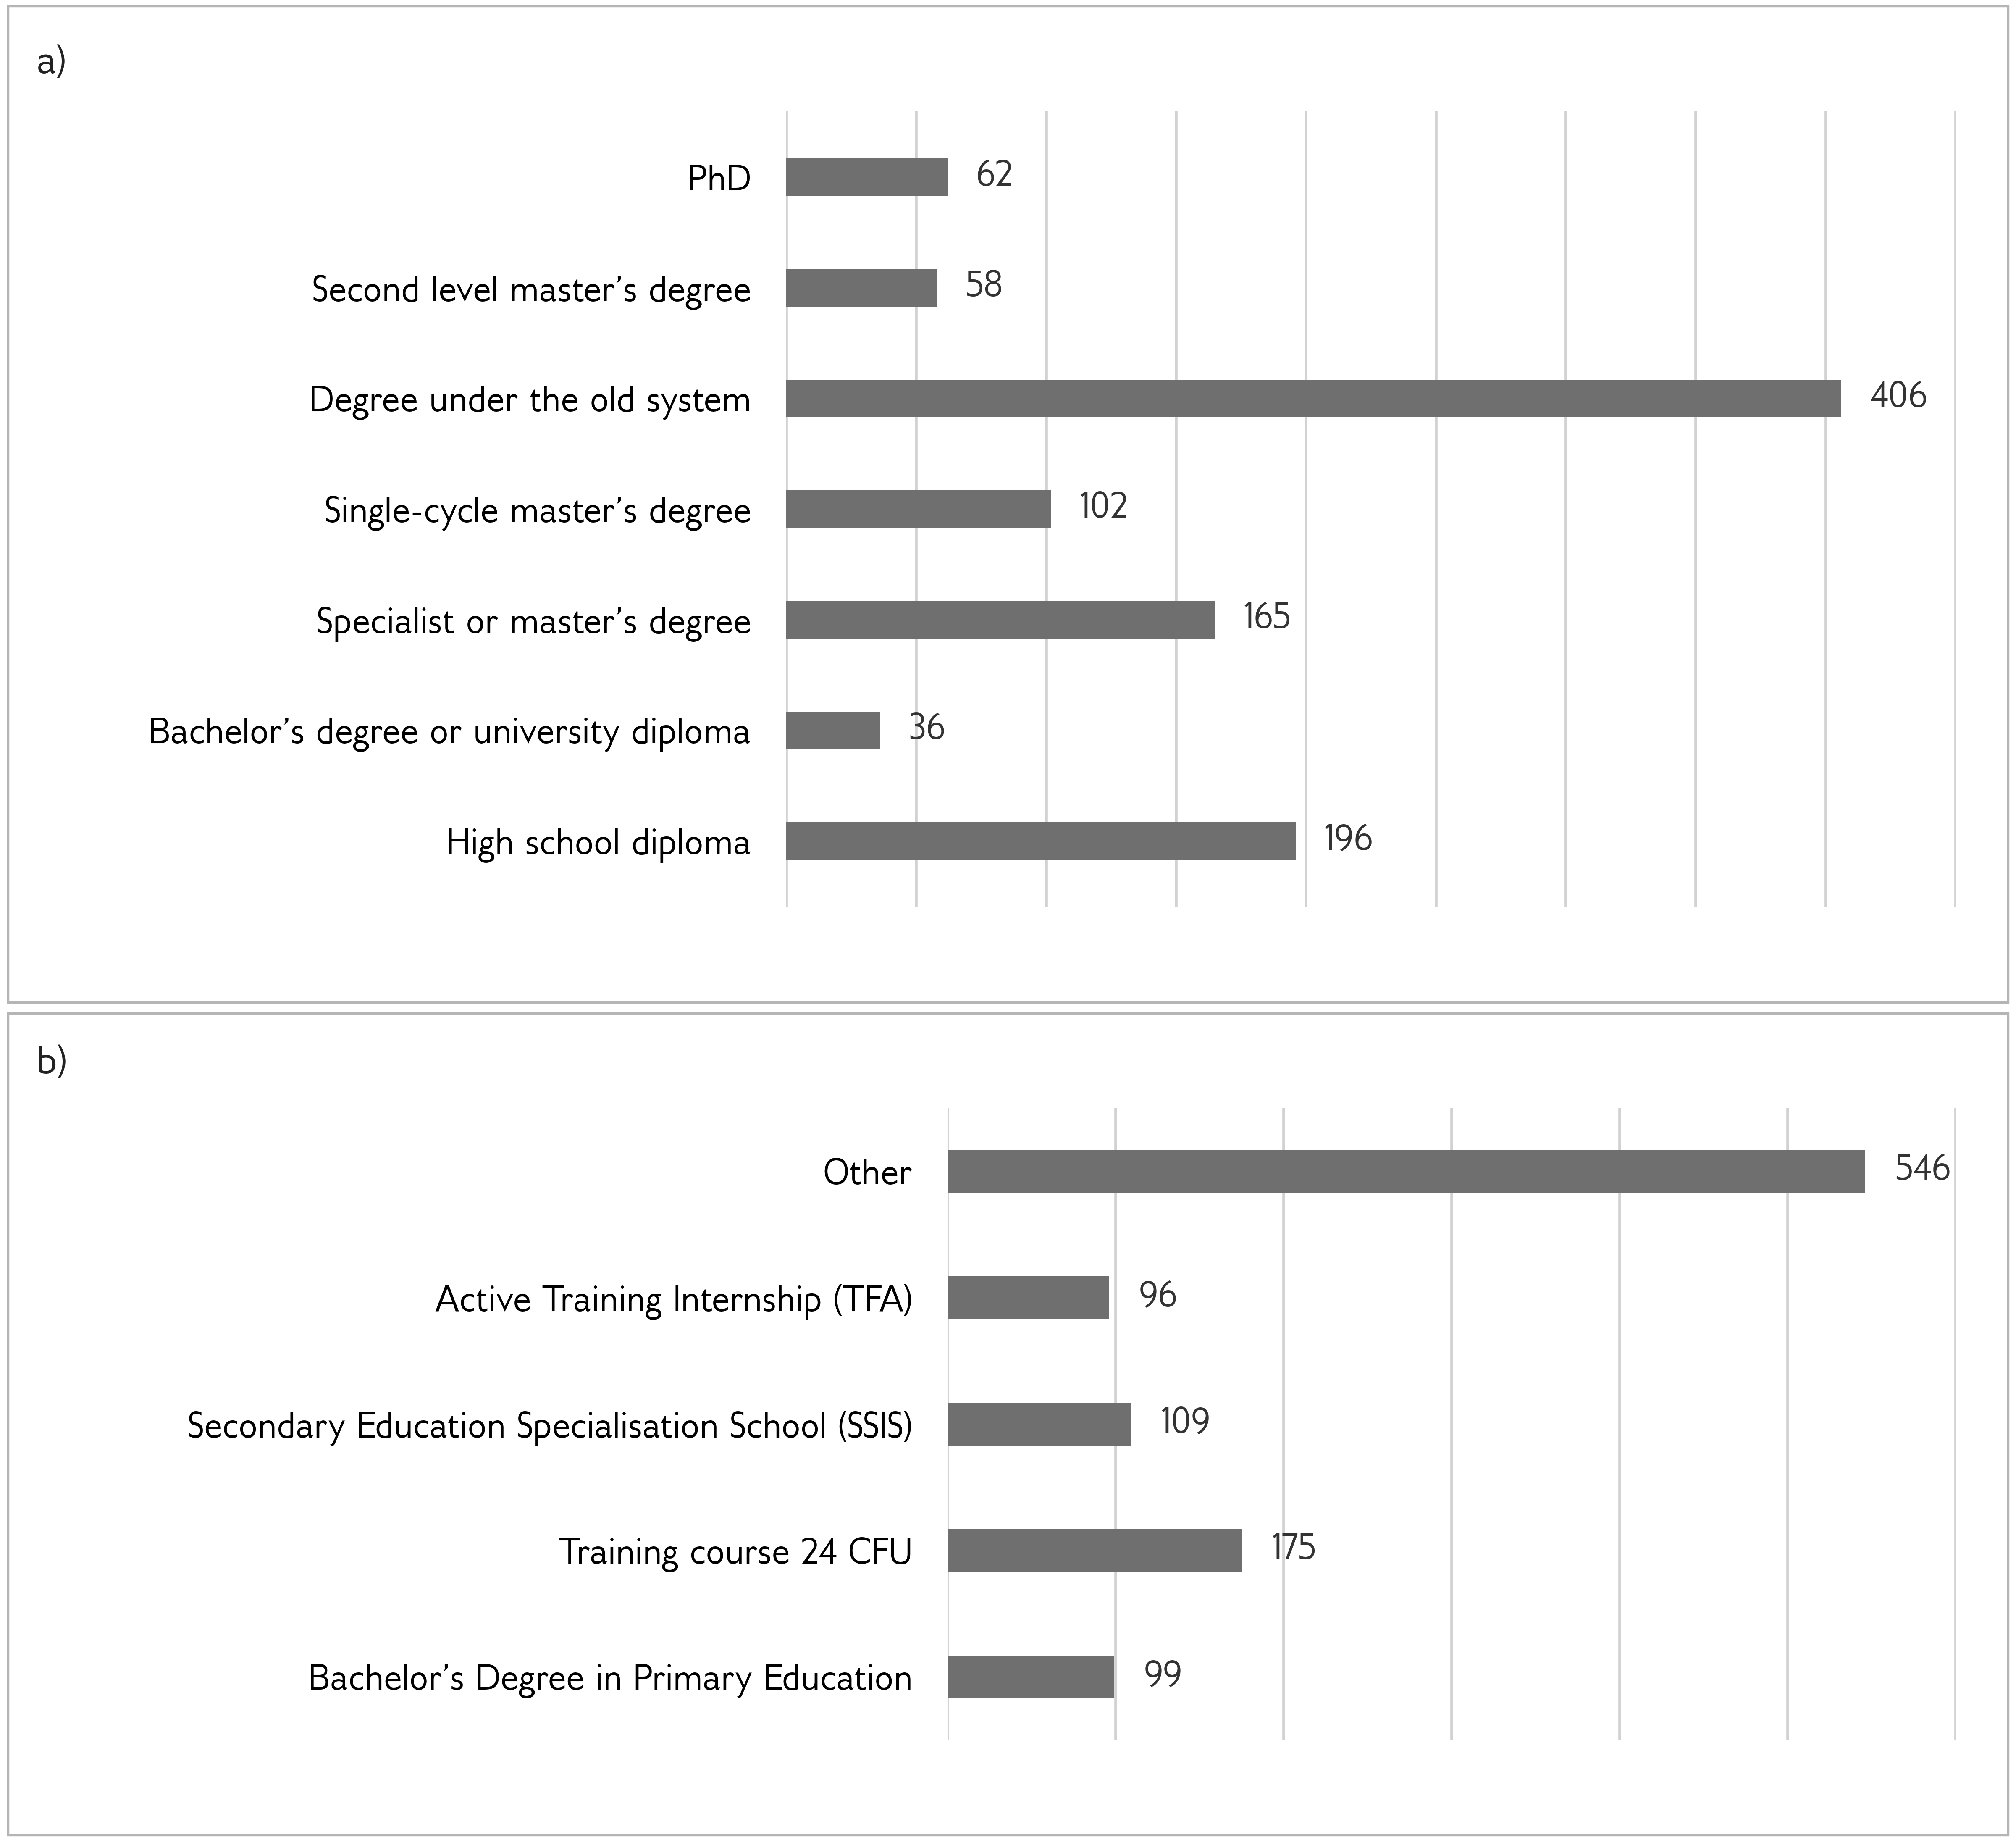
Figure 1. (a) Highest qualification obtained. (b) Initial training courses completed before entering the teaching profession.
Finally, the two graphs below provide an overview of the distribution of teachers by school level (Figure 2) and main subject area (Figure 3). The first graph shows that the largest number of teachers work in lower secondary schools (367), followed by primary schools (341) and upper secondary schools (262). Nursery schools have the lowest number of teachers involved (55), indicating a lower representation in this segment. The second graph shows the distribution of teachers by subject area. The most represented area is humanities and social sciences (318), followed by mathematics and science (290) and support (113). Other significant areas include foreign languages L2 (86), technology (78) and art and music (50). Less represented are technical subjects (32), physical education (20), religion (20) and law and economics (18).
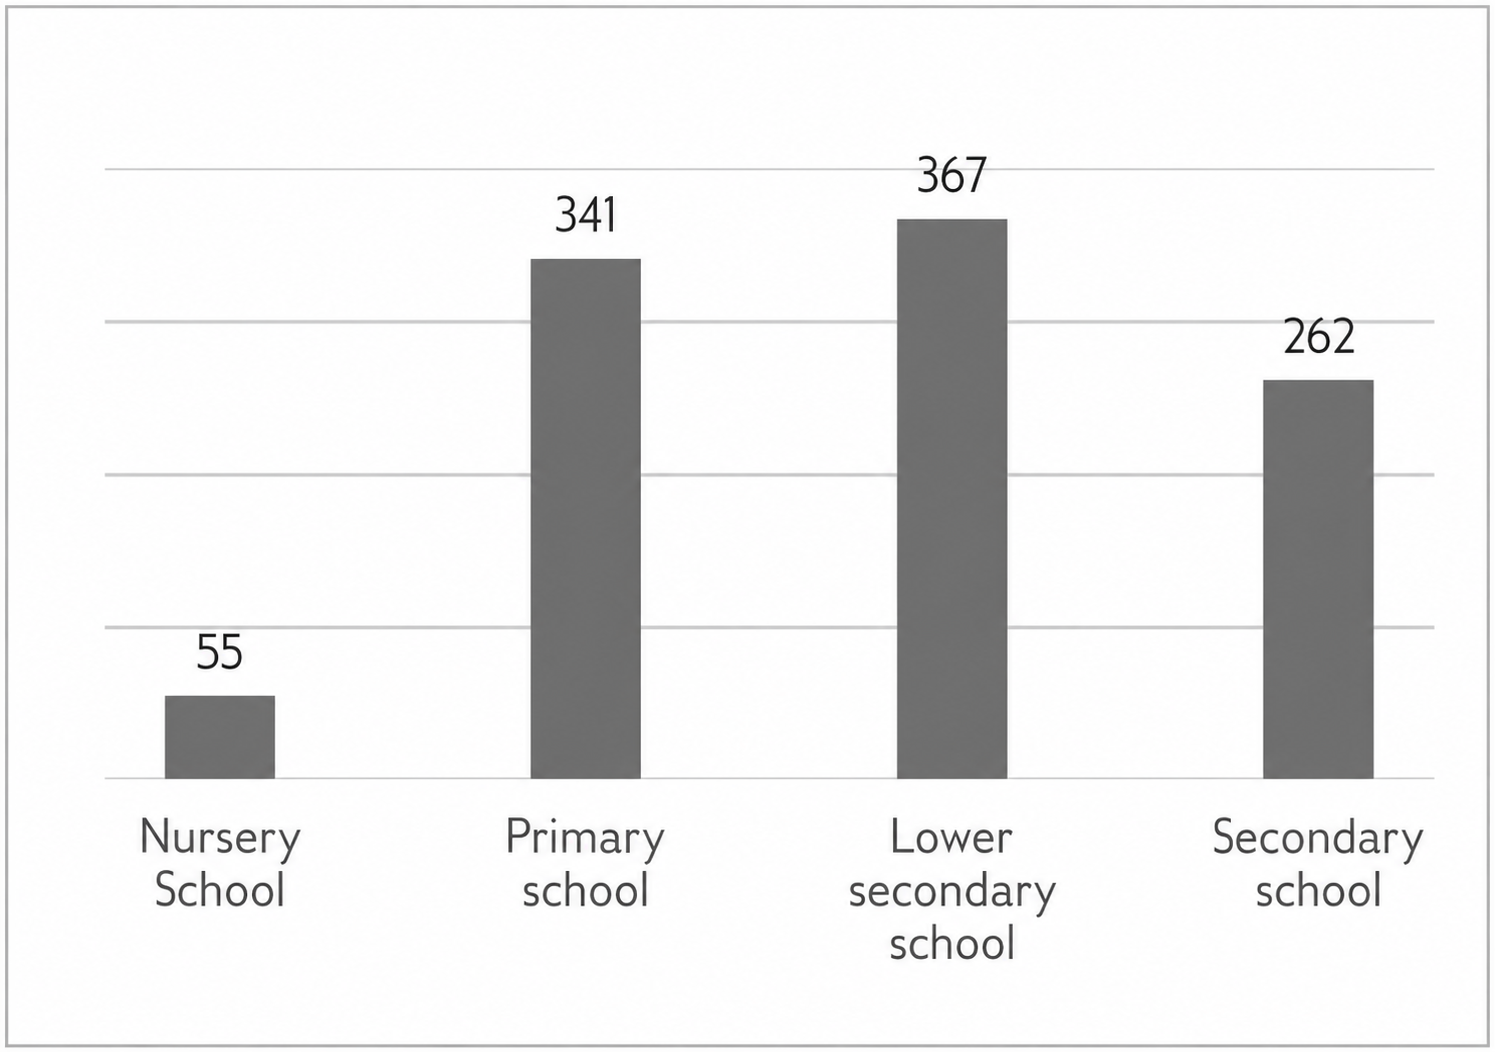
Figure 2. School level at which teachers work.
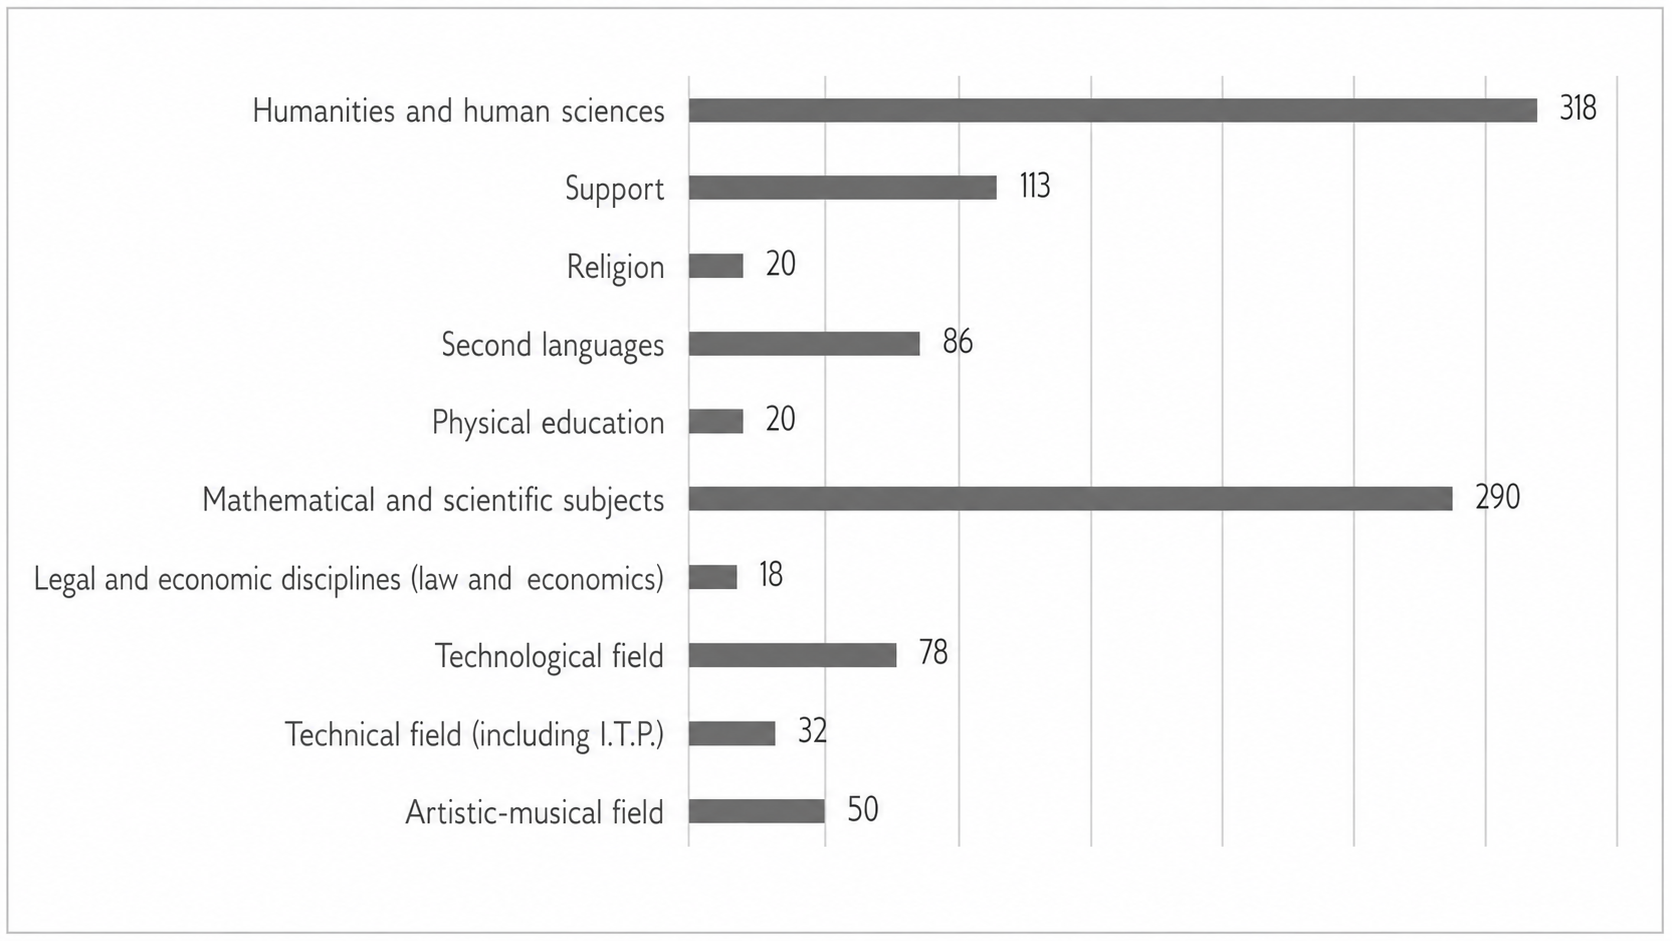
Figure 3. Main teaching subject.
Overall, there is a significant concentration of female teachers who have obtained qualifications under the old system. These are also teachers in their first 10 years of service, working in secondary schools and in the humanities and sciences.
3.2. Ethics, consent and data handling
The research was conducted in full compliance with the ethical principles governing educational research and with the provisions of the General Data Protection Regulation (EU) 2016/679 (GDPR). Prior to completing the questionnaires, all participants were informed of the purposes of the research, the voluntary nature of their participation, and their right to withdraw at any time without any negative consequences. Informed consent was collected from each participant before the administration of both the t0 and t1 questionnaires.
The questionnaires were designed to be entirely anonymous: no personally identifiable information was collected at any stage of the data gathering process. Responses were stored exclusively in aggregate form, making it impossible to trace any individual answer back to a specific respondent. The legal basis for data processing was therefore constituted by the freely given, specific and informed consent of each participant.
All data were processed and stored on servers managed by the University of Bologna, in compliance with the institution’s data protection policies. Alessandro Soriani (Department of Education Studies, University of Bologna) was designated as the person responsible for data processing and analysis. No data were shared with third parties, nor used for purposes other than those explicitly stated to participants at the time of consent.
4. Data analysis and discussion
This section presents the data collected in the various sections of the questionnaires: self-assessment of overall digital competence proficiency, assessment of each sub-competence in the DigCompEdu framework, and job satisfaction as teachers.
Some notes that may help to guide the interpretation of the graphs shown: each table shows the average Likert values (AVERAGE), the relative standard deviations (ST.DEV.) of the responses given by the course participants at two points in time, t0 (at the beginning of the training course) and t1 (at the end of the course), and the numerical variation between t1 and t0 (DELTA), designed to provide a summary indicator of the perceived change between the two assessments.
The analysis is primarily descriptive in nature. No inferential statistical tests were conducted, partly due to the absence of individual-level matched data and partly given the monitoring scope of the study. This represents a limitation, and future replications of the programme would benefit from a design that allows for significance testing.
4.1. Teachers’ digital competences
The data on the general level of digital competence (see Table 4) shows a pattern of slight but widespread improvement perceived across the different courses. Most of them show positive increases in their self-assessment, with variations that are not, however, particularly significant between the different types of course.
Despite this, it should be noted that the ‘Summer school’ and ‘Minerva’ course categories recorded the most substantial improvements (with deltas of +0.52 and +0.39 respectively), suggesting that these training formats are particularly effective in consolidating perceived digital skills. The fact that the ‘Summer school’ was entirely face-to-face, as well as the fact that the courses in the ‘Minerva’ category focused on demonstrating the potential of technology in the literary field—an element perhaps not so well explored by the learners—probably played an important role in influencing their responses.
The ‘Curriculum/Disciplines’ category shows an appreciable increase (+0.34), but not an excessive one. It is interesting to note that some categories show minimal or even negative variations: ‘Frida’ shows a slight decrease (-0.08), while ‘Environments’ and ‘Lucy’ show almost infinitesimal increases (+0.06). This could indicate that some participants have developed a greater critical awareness of their own skills, leading to more realistic rather than optimistic assessments.
It is also important to note that the standard deviations of the responses are generally high (all above 1, except in one case where the value is 0.94), highlighting a considerable variability in the participants’ self-assessments, probably reflecting the different starting levels and levels of awareness achieved by the teachers.
Course category | Average t0 | St.Dev. t0 | Average t1 | St. Dev. t1 | Delta |
All courses | 3.12 | 1.13 | 3.32 | 1.12 | 0.20 |
Summer School | 3.07 | 1.12 | 3.58 | 1.22 | 0.52 |
Environments | 2.96 | 1.08 | 3.02 | 1.03 | 0.06 |
Disciplines and Curricula | 3.22 | 1.19 | 3.56 | 1.18 | 0.34 |
Frida | 3.33 | 1.25 | 3.25 | 1.09 | -0.08 |
Lucy | 3.25 | 1.15 | 3.30 | 1.00 | 0.06 |
Marghe | 3.13 | 1.15 | 3.24 | 1.14 | 0.11 |
Mary | 3.06 | 1.10 | 3.29 | 0.70 | 0.23 |
Maia | 2.92 | 1.11 | 2.80 | 1.17 | -0.12 |
Minerva | 3.02 | 0.94 | 3.41 | 0.94 | 0.39 |
Table 4. Self-assessment of course participants on their overall level of digital competence.
4.2. Teachers’ perceptions of the DigCompEdu framework competencies
The image below (see Table 5) presents the comparative results between the two administrations (t0 and t1) relating to the six areas of competence of the DigCompEdu framework.
- Professional involvement: in the area of professional involvement, increases can be seen in all areas of competence. ‘Organisational communication’ shows the most modest improvement (from 3.61 to 3.69, with a delta of 0.09), while ‘online learning environments’ shows the most significant growth in the group (from 2.30 to 2.70 with a delta of 0.40). ‘Professional collaboration’ shows an increase of 0.26 points (from 3.15 to 3.41), followed by ‘digital technologies and infrastructure at school level’ with an improvement of 0.36 points (from 3.17 to 3.53). Particularly significant is the increase in ‘reflective practice’ (from 2.37 to 2.90 with a delta of 0.52) and ‘digital life’ (from 2.81 to 3.19). ‘Professional learning through digital technologies’ grew by 0.32 points (from 3.30 to 3.62), while ‘learning about digital technologies’ increased by 0.39 points (from 2.83 to 3.21). ‘Computational thinking’ recorded the most substantial improvement in the entire area, with an increase of 0.45 points (from 2.06 to 2.51).
- Digital resources: this area of competence also saw uniform and significant improvements across all skills. ‘Search and selection’ rose from 3.41 to 3.72 (delta +0.31), while ‘creation’ recorded the highest increase in the group (from 3.00 to 3.50, with a delta of 0.50). ‘Modify’ increased by 0.49 points (from 2.51 to 3.00), followed by ‘Management and protection’ with an increase of 0.42 points (from 2.41 to 2.84). Finally, ‘Sharing’ showed an improvement of 0.49 points, rising from 2.43 to 2.92.
- Teaching and learning: this area shows the most significant improvements in the entire framework. ‘Teaching’ recorded an increase of 0.44 points (from 2.95 to 3.39), while ‘Guidance’ showed the most significant improvement with 0.52 points (from 2.59 to 3.11). ‘Collaborative learning’ grew by 0.43 points (from 2.73 to 3.16), followed by ‘Self-regulated learning’ with an increase of 0.48 points (from 2.36 to 2.84). ‘Emerging technologies’ shows the most substantial improvement in the entire table, with an increase of 0.70 points (from 2.05 to 2.76).
- Assessment: ‘Assessment strategies’ increased by 0.38 points (from 2.58 to 2.95), while ‘Analysing evidence’ recorded the highest increase in the group with 0.45 points (from 2.28 to 2.73). ‘Feedback and planning’ shows an improvement of 0.44 points (from 2.13 to 2.58).
- Empowering learners: ‘Accessibility and inclusion’ increased by 0.67 points (from 2.54 to 3.21), representing one of the most substantial improvements in the entire questionnaire. ‘Differentiation and personalisation’ increased by 0.55 points (from 2.43 to 2.98), while ‘Actively engaging learners’ recorded the highest increase in the area with 0.60 points (from 2.50 to 3.10). ‘Blended learning’ shows an improvement of 0.49 points (from 2.58 to 3.07).
- Promoting the development of students’ digital competence: ‘Information and media literacy’ recorded the most significant increase with 0.54 points (from 2.09 to 2.63). ‘Communication and collaboration’ increased by 0.41 points (from 2.33 to 2.74), followed by ‘Content creation’ with 0.50 points (from 2.51 to 3.01). ‘Safety and well-being’ shows an improvement of 0.46 points (from 2.14 to 2.60), ‘Responsible use’ grows by 0.56 points (from 1.96 to 2.52), and ‘Problem solving’ concludes with an increase of 0.54 points (from 2.12 to 2.66).
Looking at the picture as a whole, it is immediately apparent that, in both surveys, the Likert values (which, we recall, were expressed on a scale from 0 to 6) are mainly around average values (just below or just above 3). The standard deviations show a slight reduction between t0 and t1, suggesting greater homogeneity in the post-intervention responses, while maintaining levels of variability appropriate for the validity of the measurements. There are also slight generalised improvements in all the dimensions analysed.
1. Professional engagement | Average t0 | St.Dev. t0 | Average t1 | St. Dev. t1 | Delta |
1.1 Organisational communication | 3.61 | 1.21 | 3.69 | 1.15 | 0.09 |
1.2 Online learning environment | 2.30 | 1.51 | 2.70 | 1.47 | 0.40 |
1.3 Professional collaboration | 3.15 | 1.26 | 3.41 | 1.17 | 0.26 |
1.4 Digital technologies and infrastructure at school level | 3.17 | 1.37 | 3.53 | 1.28 | 0.36 |
1.5 Reflective practice | 2.37 | 1.57 | 2.90 | 1.63 | 0.52 |
1.6 Digital life | 2.81 | 1.36 | 3.19 | 1.27 | 0.39 |
1.7 Professional learning (through digital technologies) | 3.30 | 1.29 | 3.62 | 1.20 | 0.32 |
1.8 Professional learning (about digital technologies) | 2.83 | 1.38 | 3.21 | 1.29 | 0.39 |
1.9 Computational thinking | 2.06 | 1.62 | 2.51 | 1.52 | 0.45 |
2. Digital resources | Average t0 | St.Dev. t0 | Average t1 | St. Dev. t1 | Delta |
2.1 Selecting | 3.41 | 1.26 | 3.72 | 1.23 | 0.31 |
2.2 Creating | 3.00 | 1.32 | 3.50 | 1.27 | 0.50 |
2.3 Modifying | 2.51 | 1.54 | 3.00 | 1.55 | 0.49 |
2.4 Management and protection | 2.41 | 1.35 | 2.84 | 1.44 | 0.42 |
2.5 Sharing | 2.43 | 1.40 | 2.92 | 1.48 | 0.49 |
3. Teaching and learning | Average t0 | St.Dev. t0 | Average t1 | St. Dev. t1 | Delta |
3.1 Teaching | 2.95 | 1.38 | 3.39 | 1.35 | 0.44 |
3.2 Guidance | 3.00 | 1.32 | 3.50 | 1.27 | 0.50 |
3.3 Collaborative learning | 2.73 | 1.53 | 3.16 | 1.57 | 0.43 |
3.4 Self-regulated learning | 2.36 | 1.57 | 2.84 | 1.65 | 0.48 |
3.5 Emerging technologies | 2.05 | 1.67 | 2.76 | 1.70 | 0.70 |
4. Assessment | Average t0 | St.Dev. t0 | Average t1 | St. Dev. t1 | Delta |
4.1 Assessment strategies | 2.58 | 1.49 | 2.95 | 1.58 | 0.38 |
4.2 Analysing evidence | 2.28 | 1.44 | 2.73 | 1.55 | 0.45 |
4.3 Feedback and planning | 2.13 | 1.53 | 2.58 | 1.58 | 0.44 |
5. Empowering learners | Average t0 | St.Dev. t0 | Average t1 | St. Dev. t1 | Delta |
5.1 Accessibility and inclusion | 2.54 | 1.59 | 3.21 | 1.56 | 0.67 |
5.2 Differentiation and personalisation | 2.43 | 1.52 | 2.98 | 1.61 | 0.55 |
5.3 Actively engaging students | 2.50 | 1.63 | 3.10 | 1.64 | 0.60 |
5.4 Blended learning | 2.58 | 1.52 | 3.07 | 1.57 | 0.49 |
6. Facilitating learners’ digital comp. | Average t0 | St.Dev. t0 | Average t1 | St. Dev. t1 | Delta |
6.1 Information and media literacy | 2.09 | 1.47 | 2.63 | 1.49 | 0.54 |
6.2 Communication and collaboration | 2.33 | 1.51 | 2.74 | 1.52 | 0.41 |
6.3 Content creation | 2.51 | 1.40 | 3.01 | 1.46 | 0.50 |
6.4 Safety and well-being | 2.14 | 1.53 | 2.60 | 1.58 | 0.46 |
6.5 Responsible use | 1.96 | 1.58 | 2.52 | 1.63 | 0.56 |
6.6 Problem solving | 2.12 | 1.52 | 2.66 | 1.63 | 0.54 |
Table 5. Self-assessment of course participants on their overall level of digital competence (aggregate courses).
If we consider the same data, but organised per course category (which are not reported here due to space limitations), what emerges is broadly consistent with the aggregate-level findings, but there are, however, some interesting considerations to note.
In almost all course categories, the delta between t1 and t0 is positive (indicating a perception of general improvement in digital skills among course participants), but there is one category in particular, ‘Frida’, which is an exception. In this category, a significant number of DigCompEdu competence have negative delta values, especially in areas 4 (Assessment) and 5 (Empowering learners). This inflection could indicate an initial overestimation or greater post-training awareness of one’s limitations. The courses offered within the ‘Frida’ category focused on the creation of musical and visual artefacts through digital technologies, a practice that may not be explored too frequently by teachers given the complexity of the competence involved, which must be both artistic and technical.
Another aspect worth mentioning is that some indicators (including: 1.5 for ‘Minerva’; 1.9 and 2.2 for ‘Mary’; 3.5 for ‘Discipline and Curricula’; 6.4 for ‘Maia’; 6.5 for ‘Ambienti’, ‘Frida’ and ‘Maia’) show a delta greater than 0.8, sometimes even greater than 1, which can be considered a particularly marked perceived improvement: these increases can be interpreted as evidence of the course participants’ awareness of the usefulness of the courses taken in particular areas of competence.
Overall, the data provide a consistent picture between the courses offered and the DigCompEdu reference framework, providing evidence consistent with a positive perceived impact of training interventions on teachers’ professional digital competence, but also a reflective, metacognitive and continuous improvement-oriented attitude. The analysis of the dynamics of change between t0 and t1 offers an interesting stimulus for reflection on the evaluation of the training impact and can serve as a guide for the future improvement of the courses offered.
4.2 Teachers’ job satisfaction
The table shown in the image below (see Table 6) provides a detailed overview of the data concerning the professional satisfaction and perception of the teaching role of the course participants.
Average t0 | St. Dev. t0 | Average t1 | St. Dev. t1 | Delta | Tot Average | Tot St. Dev. | |
1. The advantages of the teaching profession clearly outweigh the disadvantages | 5.76 | 1.74 | 5.61 | 1.88 | -0.15 | 5.68 | 1.81 |
2. If I could choose again, I would still choose to be a teacher | 6.64 | 1.80 | 6.34 | 1.97 | -0.30 | 6.49 | 1.89 |
3. I would like to change schools if possible | 3.26 | 2.46 | 3.59 | 2.50 | 0.33 | 3.42 | 2.48 |
4. I regret my decision to become a teacher | 1.97 | 1.76 | 2.19 | 1.96 | 0.22 | 2.08 | 1.86 |
5. I enjoy working at this school | 6.05 | 1.95 | 5.67 | 2.10 | -0.38 | 5.86 | 2.03 |
6. I wonder if I would have been better off choosing another profession | 2.35 | 1.94 | 2.45 | 2.08 | 0.10 | 2.40 | 2.01 |
7. I would recommend this school as a good place to work | 5.69 | 2.13 | 5.27 | 2.25 | -0.41 | 5.48 | 2.19 |
8. I am satisfied with my achievements at this school | 5.94 | 1.66 | 5.76 | 1.87 | -0.18 | 5.85 | 1.77 |
9. All things considered, I am satisfied with my job | 6.43 | 1.57 | 6.28 | 1.76 | -0.16 | 6.36 | 1.66 |
10. I believe that the teaching profession is valued in society | 2.91 | 1.83 | 2.88 | 1.93 | -0.04 | 2.89 | 1.88 |
11. I am satisfied with the salary I receive for my work | 3.34 | 1.99 | 3.21 | 2.13 | -0.13 | 3.27 | 2.06 |
12. Apart from the salary, I am satisfied with the terms of my employment contract | 4.62 | 2.06 | 4.42 | 2.13 | -0.19 | 4.52 | 2.09 |
13. The opinions of teachers are taken into account by policy makers at national/regional level | 2.48 | 1.64 | 2.39 | 1.76 | -0.09 | 2.44 | 1.70 |
14. Teachers can influence the education policies of the country/region | 3.65 | 2.19 | 3.56 | 2.32 | -0.09 | 3.61 | 2.26 |
15. Teachers are valued by the media at national/regional level | 2.72 | 1.64 | 2.57 | 1.71 | -0.15 | 2.64 | 1.68 |
Table 6. Teachers’ job satisfaction (overall aggregate).
The data reveals a complex picture, which warrants in-depth discussion, especially with regard to the very high standard deviation values of the various responses.
A few preliminary remarks are necessary before proceeding. The first is that two groups of items can be identified that show fairly consistent responses: those concerning satisfaction as a professional within one’s own school (items 1–10) and those concerning the socio-economic recognition of the teaching profession in general (items 11–15). The second is that the data will only be presented in aggregate form and not by course, since the tables broken down by course categories do not show significant differences that would justify such a detailed analysis. The third is that, given the low significance of the difference in values between t1 and t0, the data will be commented on as a whole, approximating the values to their average, which is still useful for understanding the overall situation.
With regard to the first group of items, it can be said that respondents report a good degree of satisfaction with their profession. Their responses show that:
- Overall, the advantages of their profession outweigh the disadvantages (item 1–5.68 with a standard deviation of 1.81);
- If they could, they would choose the teaching profession again (item 2–6.49 with a standard deviation of 1.89) and they do not regret their choice to become teachers (item 4–2.08 with a standard deviation of 1.86);
- Some of them are quite inclined to change institutions, while others consider themselves satisfied overall (item 3–3.42 with the highest standard deviation value of 2.48; item 5–5.86 with a standard deviation of 2.03; item 6–2.40 with a standard deviation of 2.01).
- Overall, most of them consider their position within the institution in which they work to be quite satisfactory and would recommend the same position to others (item 7–5.48 with a standard deviation of 2.19; item 8–5.85 with standard deviation 1.77), but the relatively high standard deviation values indicate that a significant proportion of teachers disagree with the general trend of responses;
- Most respondents believe that—all things considered—they are satisfied with their job (item 9–6.36 with a standard deviation of 1.66).
With regard to the second group of items, those concerning the socio-economic recognition of the teaching profession, the responses are consistent with a profile of teachers who are rather dissatisfied with the current situation. Their responses show that:
- The teaching profession is not perceived as sufficiently valued in society (item 10–2.89 with a standard deviation of 1.88) or is not adequately appreciated in the media (item 15–2.64 with a standard deviation of 1.68);
- The salary conditions of the teaching profession are perceived as quite unsatisfactory (item 11–3.27 with SD 2.06), while contractual conditions are considered just above average (item 12–4.52 with SD 3.09), although the high level of standard deviation highlights a large degree of difference in the responses;
- the level of consideration that policy makers have for the teaching profession does not seem to be very high (item 13–2.44 with SD 1.70) nor, consequently, the level of impact on education policies at national or regional level (item 14–3.61 with SD 2.26), although in the latter case teachers’ perceptions are somewhat more discordant and with slightly higher average values.
The data paint a picture of profound contradiction between the development of professional skills and the social, economic and institutional recognition of the teaching profession. However, these data are entirely consistent with other research in the same field, both nationally (Argentin, 2018; Cavalli et al., 2010) and internationally (OECD, 2014, 2016, 2019, 2025) which report a profile of teachers constrained by contextual limitations and striving with determination towards an increasingly challenging and difficult working future—thanks to, or because of, technologies and tools based on artificial intelligence (Holmes et al., 2022; UNESCO, 2024) .
Despite the high motivation of the teachers involved in the research and their deep conviction in the importance of their role, there are a number of issues in their working conditions that recur strongly. These issues extend beyond purely economic aspects to affect overall contractual terms, highlighting how the regulatory and organisational conditions of teaching work are perceived as inadequate. This discontent is further exacerbated when the political and institutional dimension is considered: teachers perceive a substantial lack of interest on the part of policy makers in their opinions and professional skills, feeling excluded from decision-making processes that directly affect their area of expertise.
This marginalisation translates into a perceived inability to influence educational policies at regional and national level, generating a sense of professional powerlessness that contrasts dramatically with the level of competence demonstrated in the previous analysis. The picture is completed by the persistent negative and inadequate representation of teachers in the media, which contributes to perpetuating reductive stereotypes and further undermining the social prestige of their profession.
This combination of factors creates a particularly worrying systemic paradox: while teachers demonstrate their ability to grow professionally and adapt to the contemporary challenges of digital education, the social, economic and political context not only fails to recognise this evolution, but seems to reinforce forms of devaluation that risk compromising professional motivation and, consequently, the quality of education. The long-term sustainability of the process of educational and digital innovation therefore appears to be closely linked to the need for systemic interventions that address this disconnect between professional skills and the social, economic and institutional recognition of the teaching profession.
5. Conclusions
The Digimetrò project represented a concrete opportunity to reflect on the meaning of digital empowerment in contemporary schools, helping to define new training horizons for teaching professionalism. The approach adopted, which integrated training and research, provided a complex but promising picture: on the one hand, a widespread improvement in the digital skills perceived by teachers; on the other, a consolidation of critical awareness of the structural and symbolic limitations of their profession.
The data that emerged show that educational hybridisation is not a temporary emergency, but a structural transformation that requires a profound reconsideration of educational practices, initial and in-service training, and the very role of the teacher. The effectiveness of training courses was evident in many of the course categories—especially when designed in a workshop, disciplinary and reflective manner—, but a clear need also emerged: digital empowerment cannot be treated as a set of isolated techniques or skills but must become part of a broader process of professional, ethical and social development.
However, this growth risks remaining confined to an individual and fragmented dimension if it is not accompanied by real institutional recognition. The contradictions identified between teachers’ personal motivation and their perception of public, contractual and political devaluation point to a systemic paradox. A competent, up-to-date teaching staff that is open to change, but too often excluded from decision-making processes and lacking adequate support. This is the real critical point that emerges from the work carried out.
In conclusion, while “Hybrid school” has shown that it is possible to develop meaningful digital skills training programmes, it has also made it clear that, in order to be truly transformative, such programmes must be supported by a coherent ecosystem of educational policies—in synergy with the local area and with entities that can support research and training—adequate working conditions and social recognition. Only in this way will it be possible to imagine a hybrid school that is not only technologically equipped but also culturally and professionally up to the challenges of the contemporary world.
Endnotes
The term “digital capability” deserves further explanation. The term “capability” is taken from the capability approach (Nussbaum, 2012, 2014; Sen, 1992, 2000): it takes as its pivotal point the growth of individuals so as to enable each person to build and develop their own range of skills and abilities in an inclusive and empowering way (Ellerani, 2013). Combining this concept with “digital” implies an appropriation and competence in the use of ICT that goes far beyond mere instrumental use, in the direction of real competence and participatory, responsible, ethical and conscious activation. ↑
References
Argentin, G. (2018). Gli insegnanti nella scuola italiana: Ricerche e prospettive di intervento. Il Mulino.
Cavalli, A., Argentin, G., & IARD (Eds.). (2010). Gli insegnanti italiani: come cambia il modo di fare scuola. Il Mulino.
Crompton, H. (2023). Evidence of the ISTE Standards for Educators leading to learning gains. Journal of Digital Learning in Teacher Education, 39(4), 201–219. https://doi.org/10.1080/21532974.2023.2244089
Economou, A. (2023). SELFIEforTEACHERS: Designing and developing a self-reflection tool for teachers’ digital competence. Publications Office of the European Union. https://doi.org/10.2760/561258
Ellerani, P. (2013). Gli scenari educativi e formativi internazionali in mutamento: contesti cooperativi e capability approach. Formazione & insegnamento, 11(4), 15–32. Retrieved June 12 from https://ojs.pensamultimedia.it/index.php/siref/article/view/386
Ellerani, P., Pacetti, E., Soriani, A., & Barca, D. (2023). Scuola ibrida: Monitoraggio del modello organizzativo e didattico per l’avvio di una trasformazione dei curricoli nella prospettiva “grandi fenomeni della vita” attraverso le tecnologie. Un percorso nazionale di ricerca-formazione-intervento. In A. Dipace & P. Raviolo (Eds.), New literacies: Nuovi linguaggi, nuove competenze (pp. 53–56). Editrice Morcelliana.
Eugeni, R. (2015). La condizione post-mediale. La Scuola.
European Commission. (n.d.). SELFIE for Teachers. Retrieved June 12, 2026, from https://education.ec.europa.eu/selfie-for-teachers
Floridi, L. (2017). La quarta rivoluzione: Come l’infosfera sta trasformando il mondo. Raffaello Cortina.
Holmes, W., Persson, J., Chounta, I.-A., Wasson, B., & Dimitrova, V. (2022). Artificial Intelligence and Education: A Critical View Through the Lens of Human Rights, Democracy and the Rule of Law (1st edn). Council of Europe.
ISTE - International Society for Technology in Education. (2024). ISTE standards for educators. https://iste.org/standards/educators
Mishra, P., & Koehler, M. J. (2006). Technological Pedagogical Content Knowledge: A Framework for Teacher Knowledge. Teachers College Record: The Voice of Scholarship in Education, 108(6), 1017–1054. https://doi.org/10.1111/j.1467-9620.2006.00684.x
Nussbaum, M. C. (2012). Creare capacità: Liberarsi dalla dittatura del Pil (R. Falcioni trans.). Il Mulino.
Nussbaum, M. C. (2014). Non per profitto: Perché le democrazie hanno Bisogno della cultura umanistica (R. Falcioni trans.). Il Mulino.
OECD. (2014). TALIS 2013 Results: An International Perspective on Teaching and Learning. OECD Publishing. https://doi.org/10.1787/9789264196261-en
OECD. (2016). PISA 2015 Results (Volume II): Policies and Practices for Successful Schools. OECD Publishing. https://doi.org/10.1787/9789264267510-en
OECD. (2019). TALIS 2018 Results (Volume I): Teachers and School Leaders as Lifelong Learners. OECD Publishing. https://doi.org/10.1787/1d0bc92a-en
OECD. (2025). Education GPS. Retrieved December 31, 2025, from http://gpseducation.oecd.org
Redecker, C., Punie, Y., & European Commission (Eds). (2017). European framework for the digital competence of educators: DigCompEdu. Publications Office. https://doi.org/10.2760/159770
Sen, A. (1992). La diseguaglianza: Un riesame critico (A. Balestrino trans.). Il Mulino.
Sen, A. (2000). Lo sviluppo è libertà: Perché non c’è crescita senza democrazia. Mondadori.
UNESCO. (2018). UNESCO ICT competency framework for teachers (Version 3). https://unesdoc.unesco.org/ark:/48223/pf0000265721
UNESCO. (2024). AI competency framework for teachers. https://doi.org/10.54675/ZJTE2084