Supplementary
Materials: Exploring Higher
Education Students’ Experience with AI-powered Educational Tools: The Case of
an Early Warning System
Materiali
addizionali:
Esplorare l’esperienza degli studenti universitari con strumenti educativi
basati sull’IA: Il caso di un sistema di allerta precoce
M. Elena Rodríguez
Faculty of Computer Science, Multimedia and
Telecommunications; Universitat Oberta de Catalunya,
Spain – mrodriguezgo@uoc.edu
https://orcid.org/0000-0002-8698-4615
Juliana E. Raffaghelli
FISPPA - Faculty of Philosophy, Sociology, Education
and Applied Psychology; University of Padua, Italy – juliana.raffaghelli@unipd.it
https://orcid.org/0000-0002-8753-6478
David Bañeres
Faculty of Computer Science, Multimedia and
Telecommunications; Universitat Oberta de Catalunya,
Spain – dbaneres@uoc.edu
https://orcid.org/0000-0002-0380-1319
Ana Elena Guerrero-Roldán
Faculty of Computer Science, Multimedia and
Telecommunications; Universitat Oberta de Catalunya,
Spain – aguerreror@uoc.edu
https://orcid.org/0000-0001-7073-7233
Francesca Crudele
FISPPA - Faculty of Philosophy, Sociology, Education
and Applied Psychology; University of Padua, Italy – francesca.crudele@phd.unipd.it
https://orcid.org/0000-0003-1598-2791
HOW TO CITE
Rodríguez, M. E., Raffaghelli,
J. E., Bañeres, D., Guerrero-Roldán, A. E., &
Crudele, F. (2024). Supplementary Materials: Exploring Higher Education
Students’ Experience with AI-powered Educational Tools: The Case of an Early
Warning System. Formazione & insegnamento, 22(1), S1–S5. https://ojs.pensamultimedia.it/index.php/siref/article/view/6976
Context
Courses are organised in virtual classrooms that provide access to the syllabus, resources, exercises, and different communication spaces (teacher’s blackboard, forum, and debate) where teachers and students interact. The educational model is student-centered and based on Continuous Assessment Activities (CAAs), where most students have work and family commitments. There are two types of feedback to support students —general and personalised. General feedback is addressed to all students who share a virtual classroom, and the teachers provide it through their blackboard. After each activity is assessed, each student also receives personalised feedback, together with their mark. CAAs are graded with the following qualitative scale: A (very high), B (high), C+ (sufficient), C- (low), and D (very low), where a C+ is the minimum passing grade. Grade N is used when a student does not submit the CAA.
The EWS
Our EWS (called blinded for the students) offers two outputs. First, a dashboard presents descriptive and predictive information. Second, the intervention mechanism sends feedback messages on the teachers’ behalf. Their design is underpinned by Self-Regulated Learning (SRL) theory (Pintrich, 2000; Zimmerman, 2008), commonly adopted in learning analytics research (Jivet et al., 2017; Valle et al., 2021). The dashboard mainly aims to enhance students’ metacognitive skills (supporting performance awareness, reflection, and progress monitoring) and behavioural skills (increasing course engagement and participation). Feedback messages try to improve cognitive skills (supporting goal achievement and performance improvement), behavioural skills (promoting help-seeking behaviour), and motivational/affective skills (by increasing motivation). The goals are improving student performance, increasing retention, and promoting fluent student-teacher communication.
Firstly, the student can review their profile information on the dashboard and the timeline of CAAs proposed in the course jointly with the evolution of the risk level. The dashboard is positioned on the ongoing CAA by default (CAA3 in Figure 6). Information about past CAAs can be accessed by clicking the corresponding CAA. Below the timeline, the student can first see a green-amber-red traffic light showing their low, moderate, or high risk of failing the course, respectively. Adjacent to the traffic light, self-and norm-referenced performance frames regarding the last CAA are provided. Following this, the student has a second traffic light that shows their risk of dropping out of the ongoing CAA. Finally, information about their engagement level in the ongoing CAA is provided (access to the teaching plan and communication spaces). Each area also provides textual information to clarify the display. By clicking the question mark icon, the student can obtain contextual help. The mail envelope icon is for addressing questions and concerns. The information provided by the traffic lights is computed by two different predictive models based on machine learning algorithms trained with anonymised data from past students. The failure risk prediction model issues a prediction after each CAA is graded. In contrast, the dropout risk prediction model is computed daily. The full description and evaluation of the predictive models can be found in Authors et al. (2020).
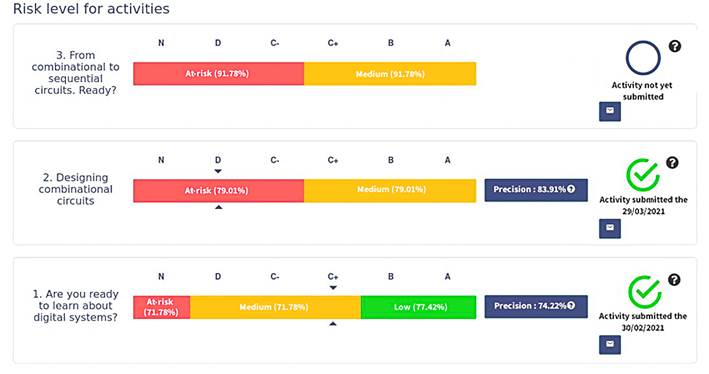
Figure 5. Student dashboard (risk level for activities).
The last section of the dashboard (see Figure 5) expands the information predicting a risk of failing. For the graded CAAs, the obtained grade is displayed using triangles (C+ for CAA1 and D for CAA2 for the student depicted in Figure 1), jointly with the risk level zones and their precision. Although such information may be helpful, it is not enough. The EWS also provides information about the risk levels associated with the ongoing CAA grades before submission. The objective is to provide early information about the minimum grade to move past the risk situation. This is achieved by simulating the failure risk prediction model with all possible grades of the CAA being analysed. The student shown in Figure 1 needs a minimum grade of C+ in CAA3 to leave the high-risk situation. Finally, the intervention mechanism triggers different message interventions, which may be adapted to suit the student’s risk situation and profile (Raffaghelli et al., 2022).
Additional tables
|
Theme |
Subtheme |
n.int. |
% cov. |
Fr.code |
% code |
n.words |
% words |
|
Tool characteristics Students’ mention of blinded characteristics during
the interview |
Email |
16 |
38.10% |
29 |
42.03% |
889 |
39.56% |
|
Introduction |
2 |
4.76% |
2 |
2.90% |
78 |
3.47% |
|
|
Lights |
5 |
11.90% |
7 |
10.14% |
224 |
9.97% |
|
|
Panel |
10 |
23.81% |
13 |
18.84% |
368 |
16.38% |
|
|
Tool-Error |
9 |
21.43% |
18 |
26.09% |
688 |
30.62% |
|
|
MTaI - IF and % |
16 |
76.19% |
69 |
17.42% |
2,247 |
18.65% |
|
|
UX-Colourlight |
Colourlight-GeneralCom |
1 |
4.55% |
1 |
4.00% |
25 |
7.65% |
|
UX on blinded characteristics: |
Always-Green |
17 |
77.27% |
18 |
72.00% |
113 |
34.56% |
|
Mostly-Green |
0 |
0.00% |
0 |
0.00% |
0 |
0.00% |
|
|
Light |
MixedGreen-Yellow |
4 |
18.18% |
6 |
24.00% |
189 |
57.80% |
|
|
Mostly-Yellow |
0 |
0.00% |
0 |
0.00% |
0 |
0.00% |
|
|
Mostly-Red |
0 |
0.00% |
0 |
0.00% |
0 |
0.00% |
|
|
MTaI - IF and % |
17 |
80.95% |
25 |
6.31% |
327 |
2.71% |
|
UX-Interest |
High |
17 |
80.95% |
36 |
87.80% |
775 |
85.26% |
|
UX on blinded characteristics: Overall perceived interest in the tool |
Middle |
2 |
9.52% |
3 |
7.32% |
90 |
9.90% |
|
Low |
2 |
9.52% |
2 |
4.88% |
44 |
4.84% |
|
|
|
MTaI - IF and % |
17 |
80.95% |
41 |
10.35% |
909 |
7.55% |
|
UX-Relevance |
High |
14 |
73.68% |
31 |
81.58% |
925 |
82.08% |
|
UX on blinded characteristics: relevance of blinded for potential future students |
Middle |
2 |
10.53% |
2 |
5.26% |
51 |
4.53% |
|
Low |
3 |
15.79% |
5 |
13.16% |
151 |
13.40% |
|
|
|
MTaI - IF and % |
14 |
66.67% |
38 |
9.60% |
1,127 |
9.36% |
|
UX-Understanding |
Excellent |
11 |
52.38% |
23 |
51.11% |
488 |
34.39% |
|
User experience on blinded characteristics: Level of understanding of the tool approach and
functions |
Good |
3 |
14.29% |
4 |
8.89% |
151 |
10.64% |
|
Regular |
7 |
33.33% |
18 |
40.00% |
780 |
54.97% |
|
|
|
MTaI - IF and % |
11 |
52.38% |
45 |
11.36% |
1,419 |
11.78% |
Table 7. Codes coverage for tool
characteristics themes.
|
Theme |
Subtheme |
n.int. |
% cov. |
Fr.code |
% code |
n.words |
% words |
|
UX-Proposals |
Design-Viz |
4 |
11.43% |
7 |
10.61% |
249 |
10.52% |
|
|
Panel-Viz |
10 |
28.57% |
24 |
36.36% |
609 |
25.72% |
|
User experience on blinded characteristics: Proposals for improvement |
Information-on-Prediction |
5 |
14.29% |
9 |
13.64% |
416 |
17.57% |
|
Provide-Deeper-Insights |
12 |
34.29% |
21 |
31.82% |
950 |
40.12% |
|
|
Tutorial |
4 |
11.43% |
5 |
7.58% |
144 |
6.08% |
|
|
|
MTaI - IF and % |
12 |
57.14% |
66 |
16.67% |
2,368 |
15.59% |
Table 8. Codes coverage for UX-proposals theme.
|
Theme |
Subtheme |
n.int. |
% cov. |
Fr.code |
% code |
n.words |
% words |
|
Opinion on data
capture |
Open-Cautious |
8 |
33.33% |
12 |
30.00% |
521 |
33.85% |
|
Open-Proactive |
13 |
54.17% |
24 |
60.00% |
893 |
58.02% |
|
|
Problems
connected to data privacy |
Restricted-Cautious |
3 |
12.50% |
4 |
10.00% |
125 |
8.12% |
|
Restricted-Proactive |
0 |
0.00% |
0 |
0.00% |
0 |
0.00% |
|
|
|
MTaI - IF and % |
13 |
61.90% |
40 |
10.10% |
1,539 |
12.78% |
Table 9. Codes coverage for data capture theme.
|
Theme |
Subtheme |
n.int. |
% cov. |
Fr.code |
% code |
n.words |
% words |
|
AI-Experience |
AutomatedEdSystem |
7 |
36.84% |
10 |
40.00% |
235 |
29.78% |
|
Overall opinion
experience and opinion on AI systems in society and education |
ImageProcessing |
3 |
15.79% |
5 |
20.00% |
252 |
31.94% |
|
RecommenderSystem |
7 |
36.84% |
8 |
32.00% |
211 |
26.74% |
|
|
TutorEd |
2 |
10.53% |
2 |
8.00% |
91 |
11.53% |
|
|
|
MTaI - IF and % |
7 |
33.33% |
25 |
6.31% |
789 |
6.55% |
|
Expectations |
Curiosity |
3 |
30.00% |
3 |
25.00% |
53 |
20.95% |
|
Initial
expectations relating to the usage of an EWS like blinded |
HighExpectations |
1 |
10.00% |
1 |
8.33% |
38 |
15.02% |
|
LowExpectations |
6 |
60.00% |
8 |
66.67% |
162 |
64.03% |
|
|
|
MTaI - IF and % |
6 |
28.57% |
12 |
3.03% |
253 |
2.10% |
Table 10. Codes coverage for AI experience and expectations themes.
|
Theme |
Subtheme |
n.int. |
% cov. |
Fr.code |
% code |
n.words |
% words |
|
Self-efficacy |
Very-High |
4 |
17.39% |
4 |
11.43% |
109 |
10.21% |
|
Students’
perception of ability to organise their academic work and get good results |
High |
11 |
47.83% |
14 |
40.00% |
409 |
38.30% |
|
NeitherLow-NorHigh |
3 |
13.04% |
8 |
22.86% |
330 |
30.90% |
|
|
Low |
5 |
21.74% |
9 |
25.71% |
220 |
20.60% |
|
|
Very-Low |
0 |
0.00% |
0 |
0.00% |
0 |
0.00% |
|
|
|
MTaI - IF and % |
11 |
52.38% |
35 |
8.84% |
1,068 |
8.87% |
Table 11. Codes coverage for self-efficacy theme.
References
Raffaghelli, J. E., Rodríguez, M. E., Guerrero-Roldán, A.-E., & Bañeres, D. (2022). Applying the UTAUT model to explain the
students’ acceptance of an early warning system in Higher Education. Computers
& Education, 182, 104468. https://doi.org/10.1016/j.compedu.2022.104468